
How Long Does It Take to Charge a Portable Power Station?
Calculate portable power station charging time for AC wall charging and solar panels. Worked example with our real EcoFlow RIVER 3 test data, taper included.
The honest answer is one simple division — then a handful of real-world corrections. A portable power station charges when input power flows into its battery faster than the battery is being drained. To estimate charging time, divide the energy you need to replace by the actual input power the battery receives, then add efficiency loss and taper.
Quick formula:
Hours ≈ (Battery Wh × Charge % Needed) ÷ (Real Input W × Charge Efficiency)
For most lithium-based stations, charge efficiency is roughly 85–95% from AC and slightly lower from solar because panel output bounces around. The last 10–20% of any charge is slower because the battery management system (BMS) tapers current to protect the cells, so a “full” charge always takes longer than the linear math suggests.
Below is a worked example using our own controlled test of the EcoFlow RIVER 3, plus the solar version of the same math.
What you actually need to know before calculating
Three numbers control everything:
- Usable battery capacity (Wh). Use the station’s usable capacity, not the inverter rating. A “1,000W” station may only store 1,024Wh.
- Real input power (W). This is the power reaching the battery after the AC adapter or MPPT charge controller. Wall power from a meter is close but not identical; some energy is lost as heat.
- Depth of charge needed. Charging from 20% to 80% is faster than 0% to 100% because the taper happens almost entirely above 80%.
If you are sizing solar, swap #2 for real panel output, which is almost never the sticker rating. Our solar recharge time calculator bakes in the 50–75% real-world derating so you do not have to guess.
AC charging example: EcoFlow RIVER 3 from 3% to 100%
We ran a controlled AC charge on a single EcoFlow RIVER 3 unit in a 29 °C room. The unit was off, all outputs were disabled, and we logged wall power every few minutes from a Deli power meter. The full RIVER 3 charging test also covers the 0% dead-battery recovery and both thermal sessions.
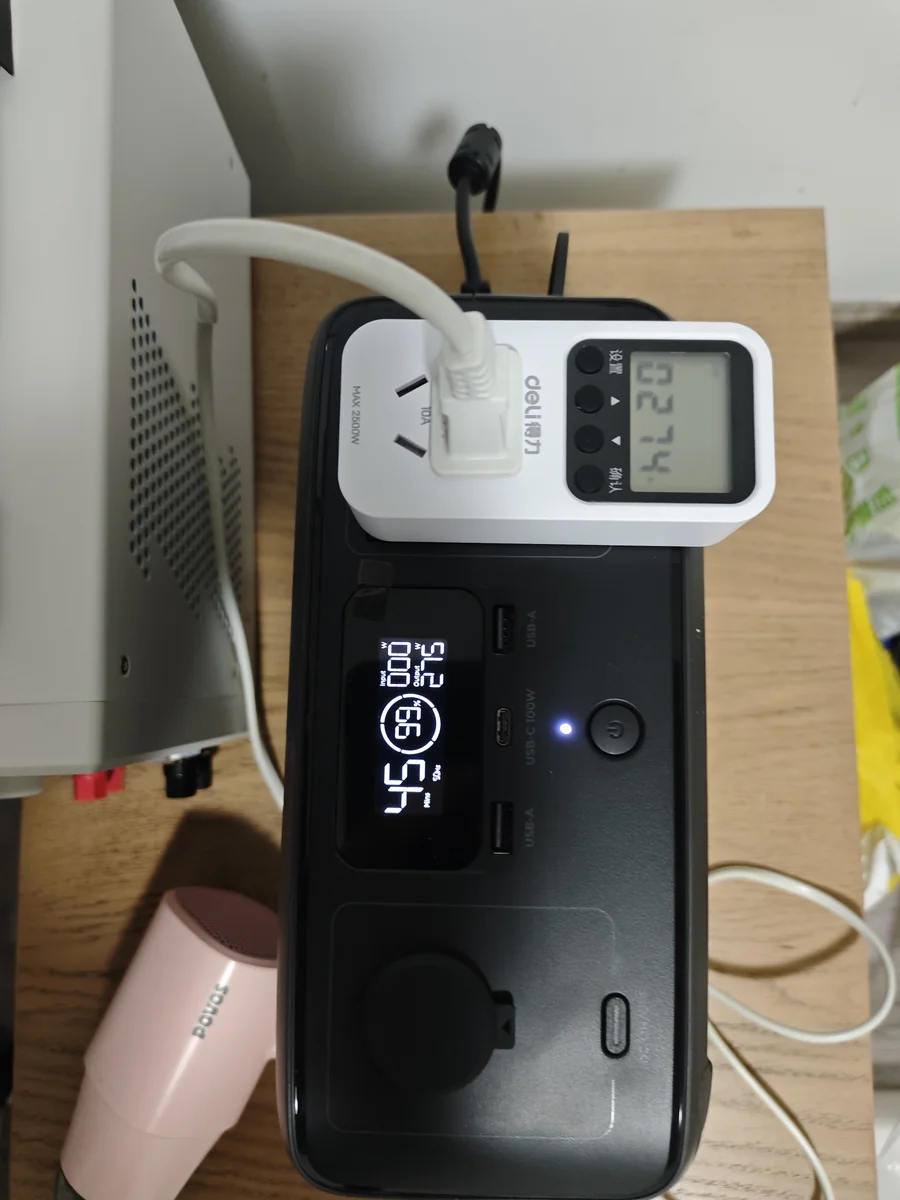 Figure 1: AC charging test setup — wall outlet → power meter → EcoFlow RIVER 3. The display shows 3% state of charge at the start of the run.
The headline result:
| Metric | Value |
|---|---|
| Start SoC | 3% |
| End SoC | 100% |
| Total time to 100% | 51 minutes |
| Peak wall input | 307 W |
| Typical mid-charge input | 304–307 W |
| Input at 91% (taper start) | ~215 W |
| Wall input at 100% display | 0 W |
| Peak case temperature | 38.8 °C near the fan/vent |
| 50 cm noise | 37.4–38.5 dB |
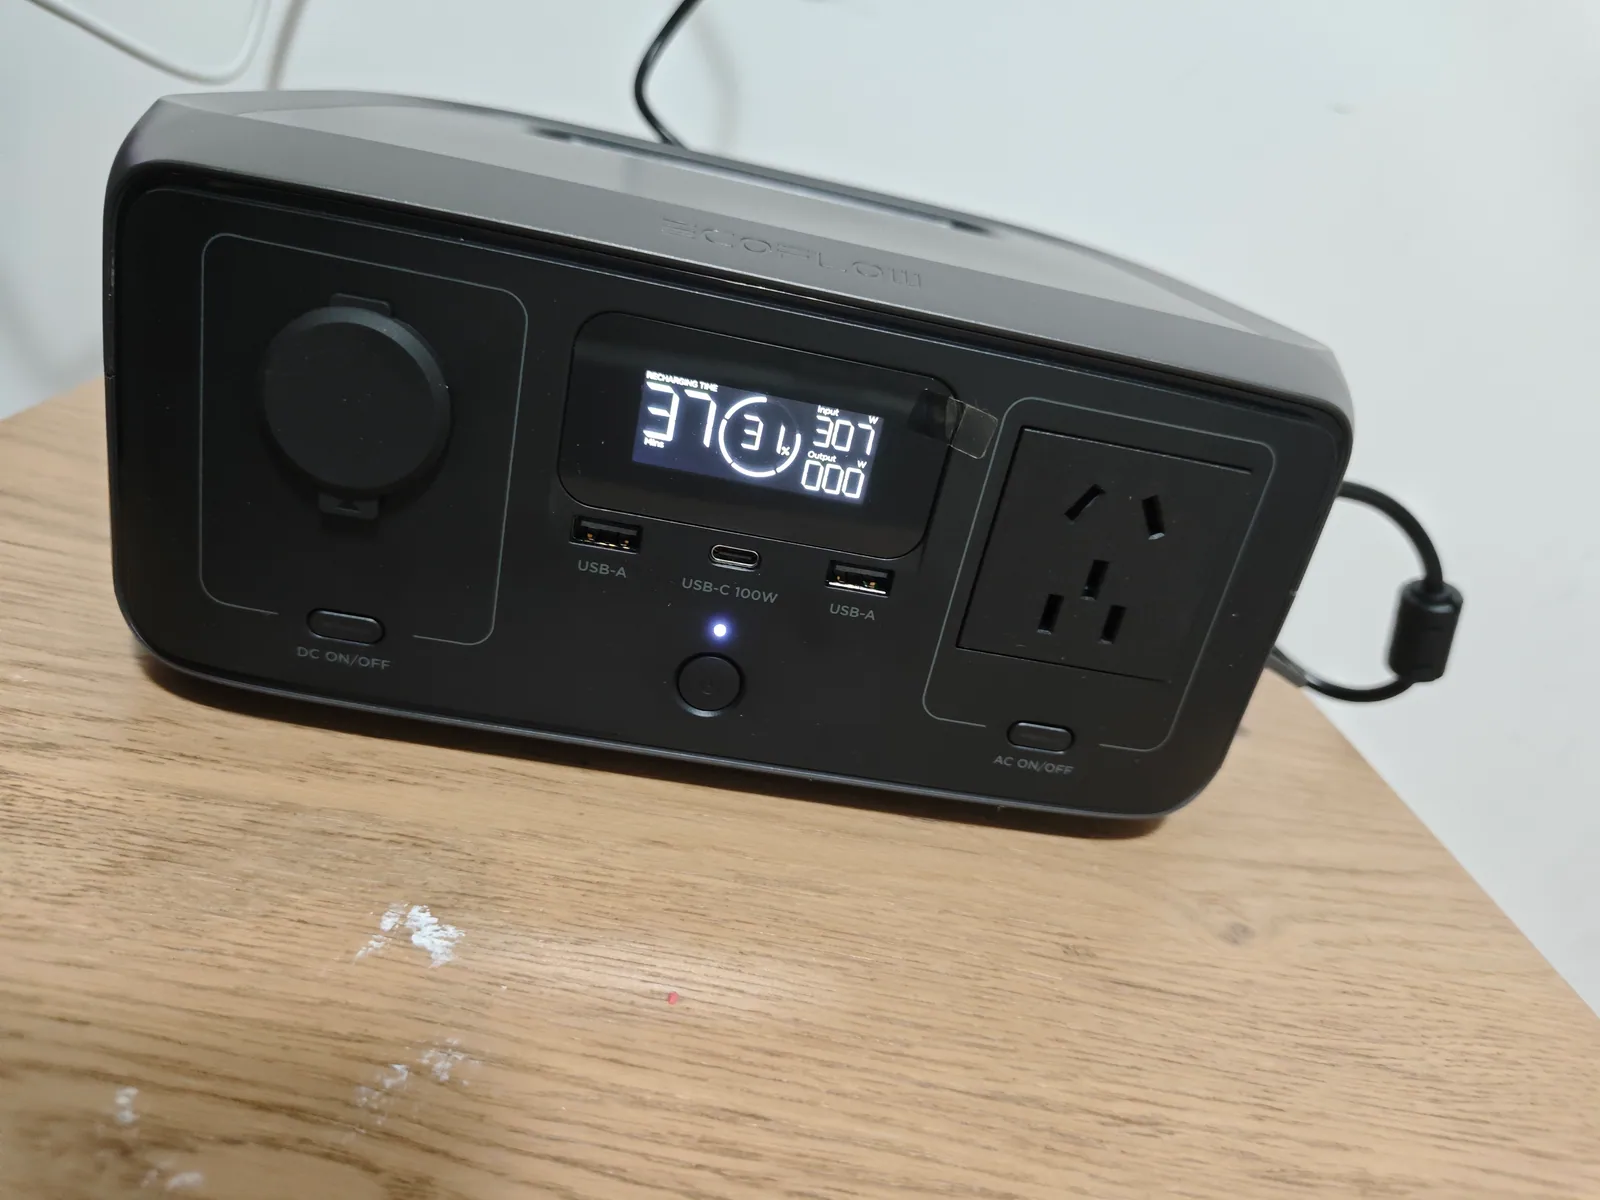 Figure 2: Mid-charge snapshot showing 307 W wall input at 37% state of charge — close to the sustained rate we saw through most of the cycle.
How the math checks out
The RIVER 3 has a 245.76 Wh nominal battery. From 3% to 100% we needed to replace roughly 238 Wh at the pack level.
- Linear estimate: 238 Wh ÷ 305 W ≈ 0.78 hours (47 minutes)
- Actual time: 51 minutes
The 4-minute gap is the taper. Between roughly 91% and 100%, input dropped from ~304 W to ~215 W and then to near zero. That late-stage slowdown is normal and healthy for the cells. Trying to force the full sticker wattage all the way to 100% would shorten battery life.
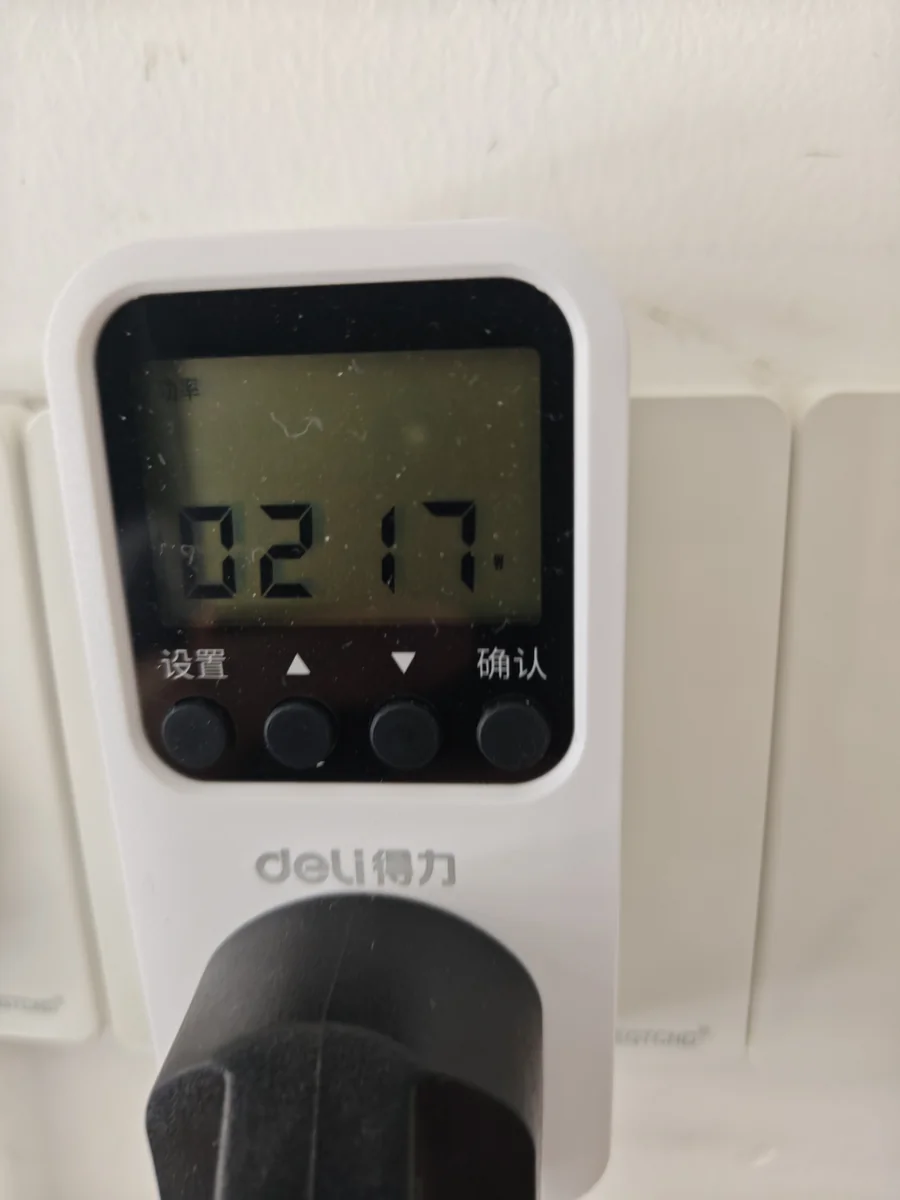 Figure 3: Late-stage taper at ~217 W. This is why the last 10% of any lithium charge takes disproportionately longer than the middle 80%.
Data note: We estimate the 3%→100% session drew about 248 Wh from the wall, calculated from time-stamped power samples (trapezoid method). The meter’s cumulative kWh display was not reset before the test, so we did not use it directly. This is a single-unit measurement; your exact time may vary with ambient temperature, unit age, and firmware.
Solar charging example: same station, different rules
Solar is less predictable because panel output changes minute by minute. Use this version of the formula:
Hours of strong sun ≈ (Battery Wh × Charge % Needed) ÷ (Panel Rated W × Real-World Factor × Charge Efficiency)
For the RIVER 3, solar input is limited to 110 W (official spec). If you paired it with a 160 W portable panel, the math looks like this:
| Assumption | Value |
|---|---|
| Energy to replace | 238 Wh (3%→100%) |
| Panel rated output | 160 W |
| Real-world factor | 65% (heat, angle, haze) |
| Real panel output | ~104 W |
| Charge efficiency | ~90% |
| Effective input | ~94 W |
| Estimated time in strong sun | ~2.5 hours |
That 2.5 hours is concentrated midday sun. Most locations only get 4–5 peak-sun-hour equivalents per day, so in practice the station reaches full charge over the better part of a clear day. Cloud, winter sun, or partial shading can double or triple that.
If you want a quick number without hand-calculating derating, use our solar recharge time calculator. It handles the panel-loss math and peak-sun-hour conversion for you.
Why real charging time is usually slower than the marketing number
Manufacturers often list the fastest possible 0–80% time under ideal conditions. Real life adds drag:
- AC adapter derating. A 500 W adapter may deliver 500 W when the battery is low and cool, but less as it warms.
- Battery temperature. Cold batteries charge slower; very hot batteries throttle input to protect cells.
- Fan noise and thermal throttling. Our RIVER 3 fan kicked in around 24% and kept case temperature below 39 °C. Larger units with bigger adapters can run hotter and throttle harder.
- The 80–100% taper. This is the biggest hidden factor. The last fifth of the charge can take 30–50% of the total time.
- Background loads. If the station is powering something while charging, that energy does not go into the battery.
How to make a power station charge faster
- Use the highest-rated input the station allows. For AC, that usually means the bundled fast charger. For solar, add panel wattage up to the station’s MPPT limit.
- Charge in a cool, ventilated spot. Heat is the main reason input power drops.
- Stop at 80% when speed matters. The taper above 80% is where time balloons; 20%→80% is usually twice as fast per percent as 80%→100%.
- Angle panels square to the sun and re-tilt through the day. A panel lying flat loses 20–30% versus one aimed directly at the sun.
- Combine inputs when the station supports it. Some larger units let you stack AC + solar for the fastest possible recovery.
When this matters for buying decisions
If you plan to recharge mainly from solar, a station with a high solar-input ceiling and efficient MPPT will repay the premium faster than a cheaper unit with a low solar limit. If you recharge mainly from a wall outlet, the AC input wattage and whether the charger is built-in or external matter more.
For a deeper look at one compact example, see our EcoFlow RIVER 3 review, which includes the full charging curve, noise data, and runtime tests.
FAQ
Frequently Asked Questions
How long does it take to charge a portable power station from solar?
Why is the last 10% of charging so slow?
Can I charge a power station while using it?
Is the wall power meter reading the same as battery input?
How do I estimate solar charging without doing the math by hand?
Bottom line
For AC charging, expect roughly (Battery Wh × Charge %) ÷ (Real Input W × 0.9) hours, with the last 10–20% taking disproportionately longer. For solar, cut the panel rating in half to two-thirds before doing the same math, and remember that “peak sun hours” are shorter than daylight hours.
Our controlled RIVER 3 test produced 51 minutes from 3% to 100% on AC and would need roughly 2.5 hours of concentrated midday sun on a 160 W panel — a useful anchor point for any similar compact lithium power station.